Is a Gantt Chart a Roadmap?
One question we’ve heard many times at ProductPlan is: Aren’t Gantt charts and roadmaps just different ways of viewing the same thing? We understand the confusion. Both tools display information related to completing a long-term project, such as developing a product. Both tools also set milestones for various aspects of the project over time.
But our answer to this common question is a clear No: Gantt charts and roadmaps are different tools with very different strategic purposes. We’ll explain those differences in this post.
Gantt Charts vs. Roadmaps
What is a Gantt chart?
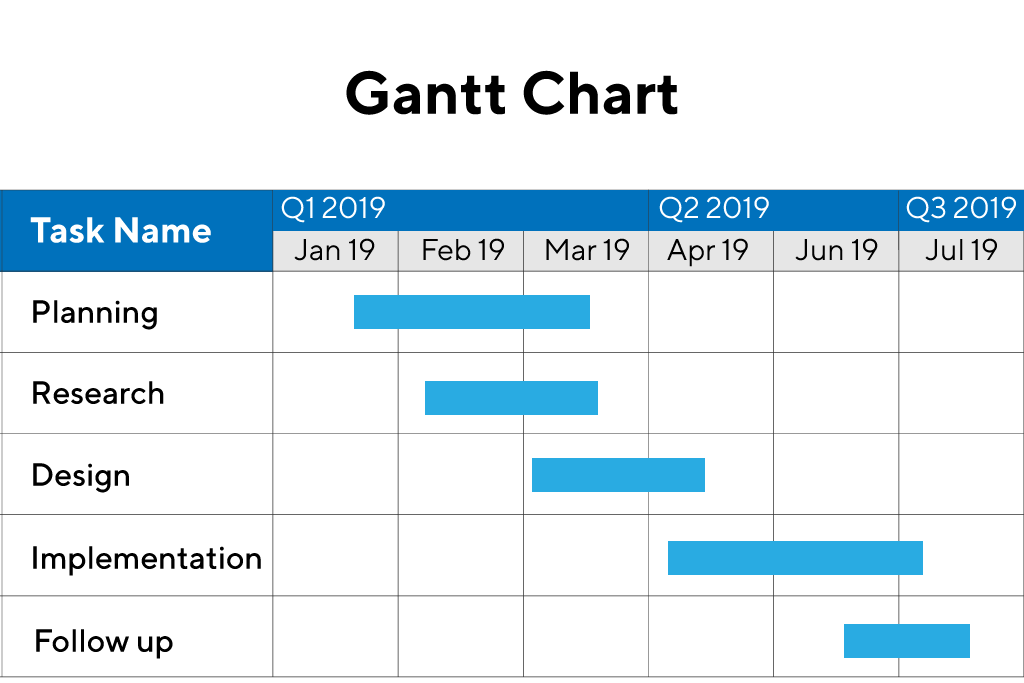
A Gantt chart is a bar chart that displays a detailed schedule of tasks related to a single project. The two defining elements of Gantt charts are:
- They represent a linear schedule.
- They capture task dependencies.
In other words, Gantt charts help show cross-functional teams what work they must complete, in what order, before they can move on to the next stage of a project.
Another way to understand this: A Gantt chart can help a team set a plan that details how they will complete a project. On the other hand, a roadmap will help them define and communicate why they should complete it. We’ll discuss that below.
What is a roadmap?
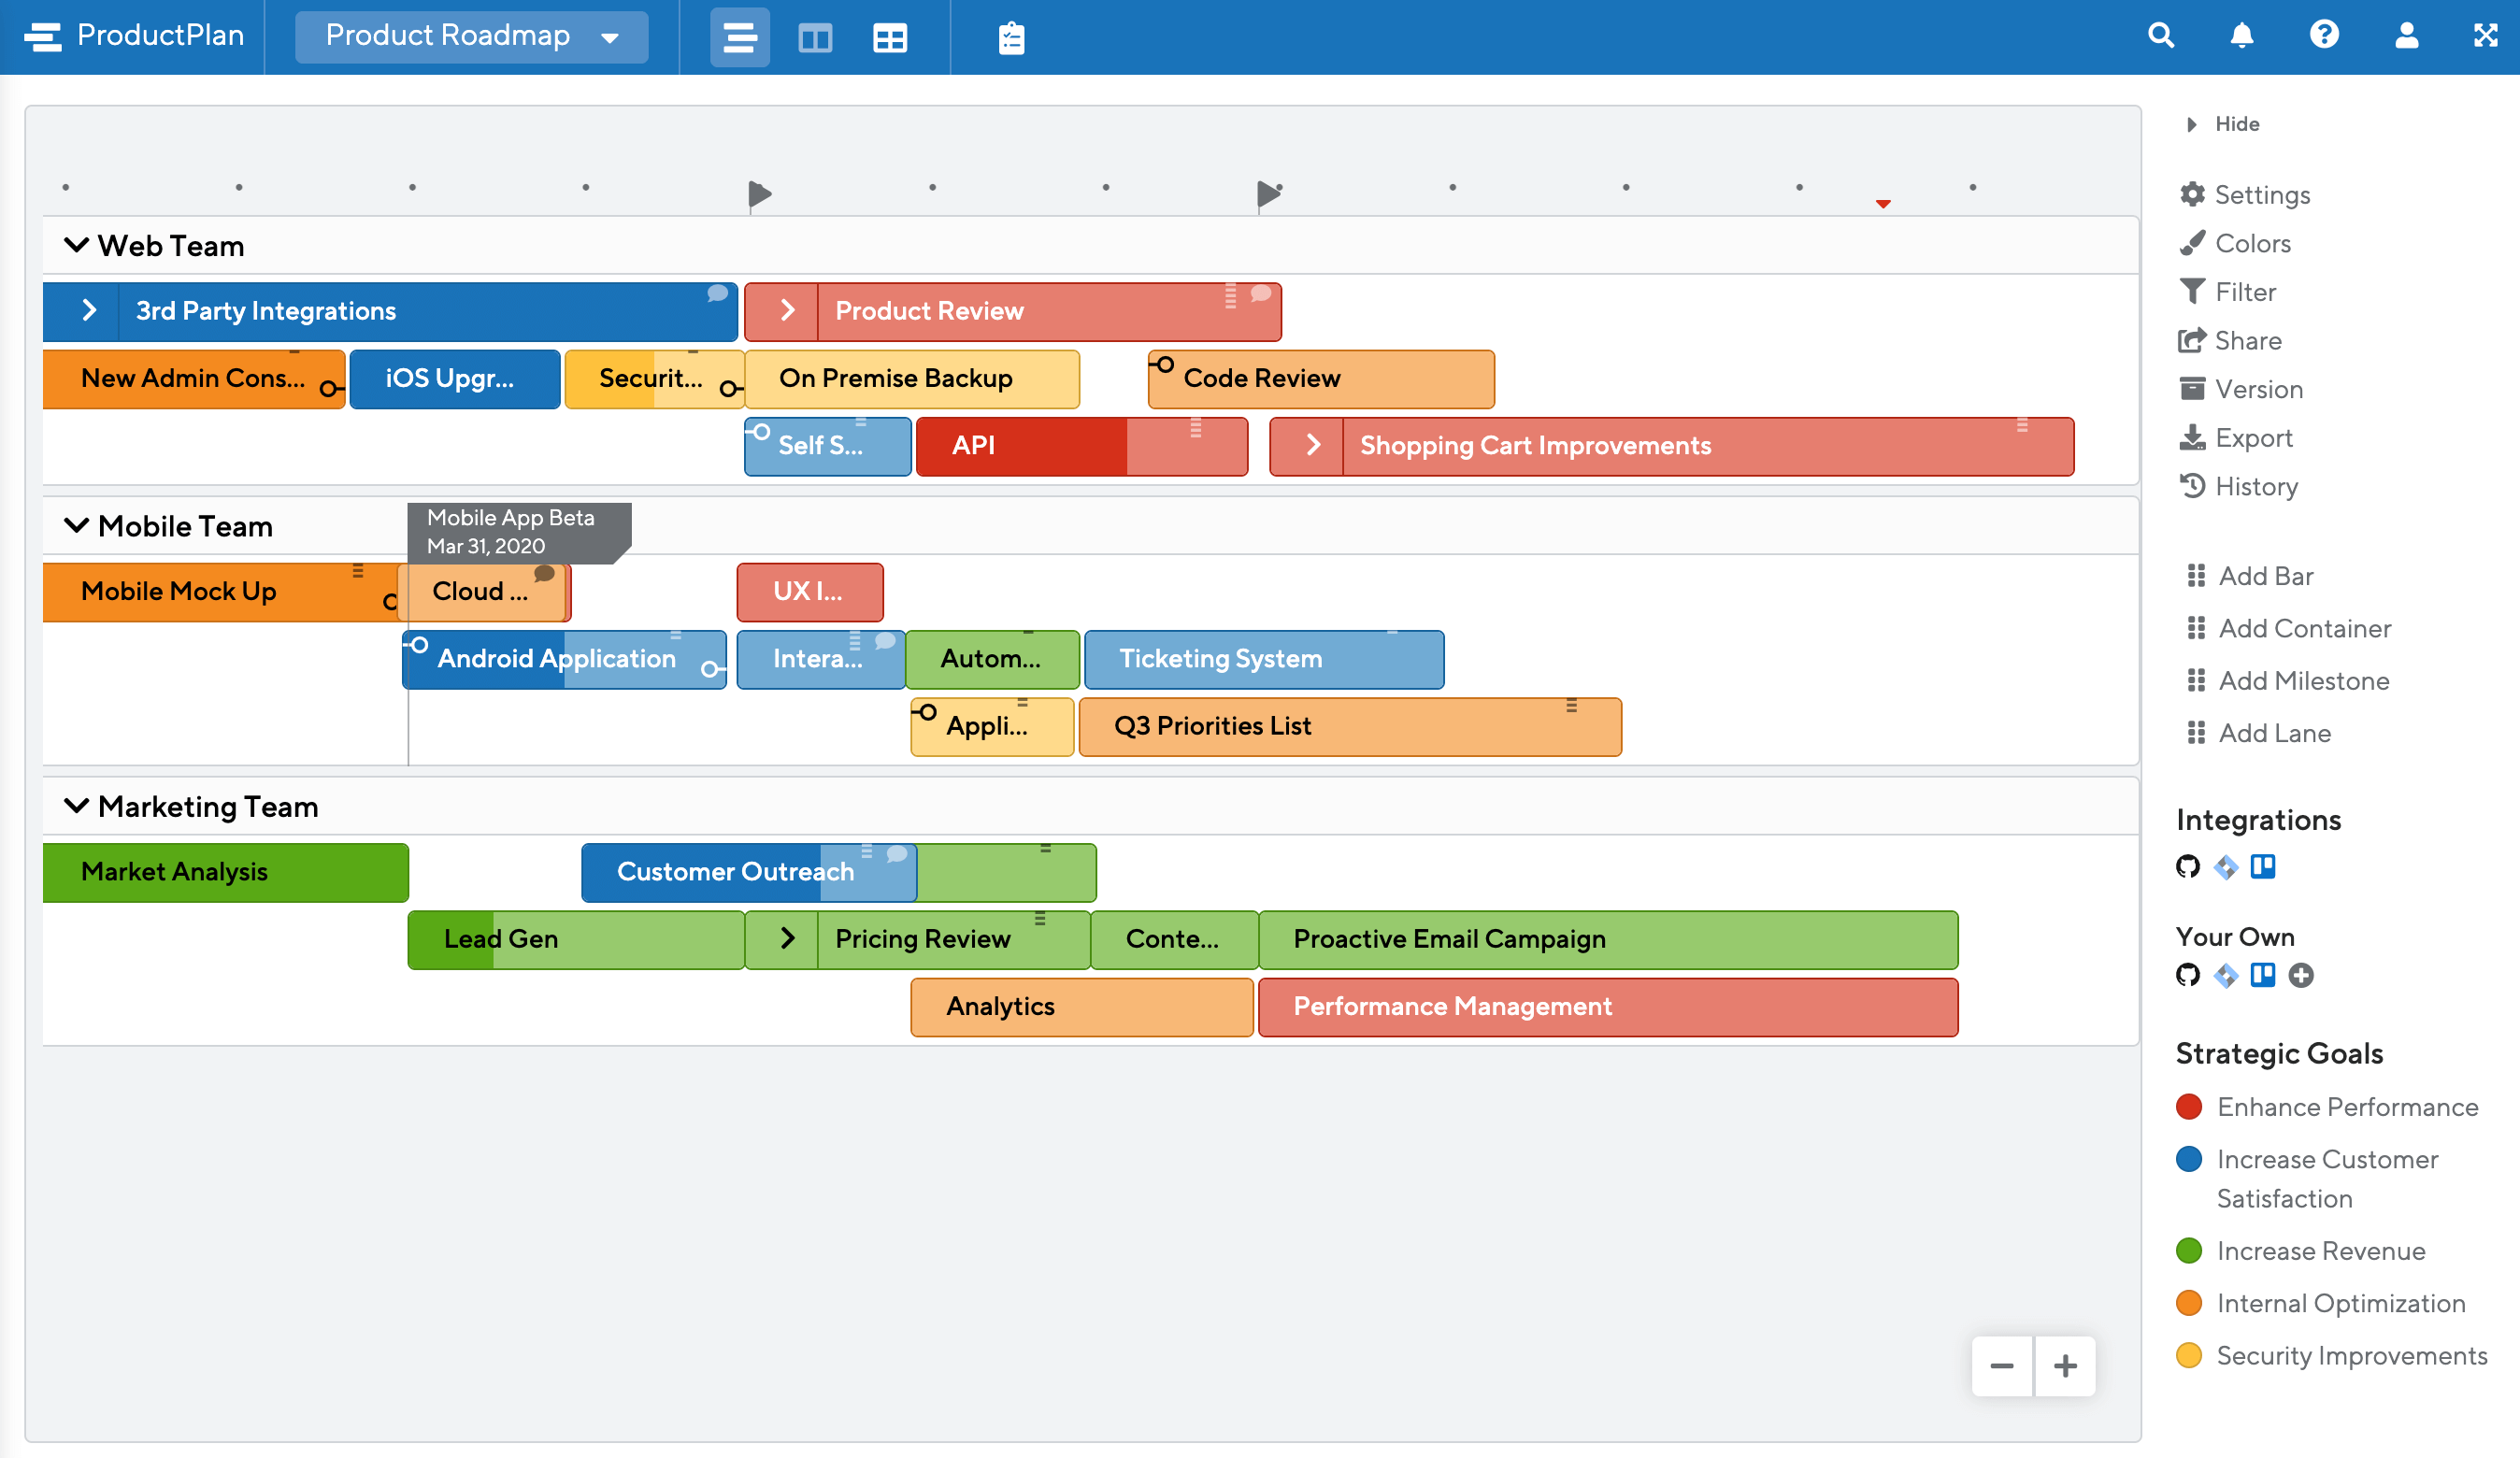
A roadmap sets a strategic plan and goals for completing a major undertaking, such as building and releasing a product.
The defining elements of roadmaps are:
- They focus on high-level plans (not the details).
- They communicate the strategic thinking and objectives behind those high-level plans.
A company can use a roadmap and Gantt chart for the same large-scale initiative. The roadmap defines the why behind the project. The Gantt chart establishes how and when. Let’s discuss a hypothetical example.
Roadmap for a housing development project.
Imagine a real estate development company planning to build a new residential neighborhood of single-family homes.
Before they can start working on the task-level details (applying for building permits, renting construction equipment), they need to decide on their big-picture strategy and plans. In other words, the roadmap comes before the Gantt chart. The roadmap could include:
A high-level theme: Build a quality neighborhood for young families
A broad timeline of milestones:
- Models will be done by X timeframe.
- Sales offices will be up and running by X timeframe.
- The properties will be sold in 3 phases, over 18 months.
The roadmap captures the high-level strategy. It will also help the company communicate its strategic thinking to investors. The team can also use the roadmap as a strategic guidepost, a tool they can check in with periodically to make sure they’re executing according to their plan.
Gantt chart for a housing development project.
After the company agrees on these strategic plans and objectives, it can translate those high-level plans into the detailed, task-dependent steps its various teams will need to complete. This is where there the Gantt chart comes into play.
The Gantt chart will contain such details as:
- The excavation and leveling will take X days and must be complete by this date.
- The government affairs team needs to secure all relevant city permits by this date.
- The utility teams must coordinate with the city to run piping and electricity by this date.
- The underground piping work will take X days and must be complete by this date.
- The concrete must be poured and foundations laid by this date.
- The plumbing and electrical teams must complete their work by this date.
- The drywall and flooring teams must complete their work by this date.
- The interior designers need to submit their drawings and plans by this date.
In reality, this list would be much longer and contain much more detail. The point is, the Gantt chart represents each task that must be completed, in order, before the company can move onto the next one.
For example, if the government affairs team fails to secure the right permits, the utility team cannot run piping and other neighborhood services. If the piping isn’t laid under each lot, the foundation teams can’t begin pouring concrete.
Are Gantt Charts Agile?
Although agile organizations often use Gantt charts, the charts themselves do not reflect or support the agile framework.
When it comes to building products, agile emphasizes flexibility and adaptability. The approach also encourages teams to iterate often and frequently push out new versions to gain user feedback.
In fact, Gantt charts represent the opposite of agile. They emphasize linear work, task dependencies, and high levels of detail. They favor mapping out every step of a project before starting, setting do-or-die deadlines, and focusing on the output rather than the strategic outcome, which roadmaps focus on.
In other words, Gantt charts represent more of a waterfall approach to development and project management. And the agile methodology was designed specifically as an answer to the shortcomings of waterfall.
Are Product Roadmaps Agile?
This is another key difference between roadmaps and Gantt charts. While Gantt charts do not support the quick changes of direction often required in an agile environment, product roadmaps can definitely represent the agile framework.
Roadmaps capture only the high-level strategic plans and desired outcomes of a large initiative, such as building a product. Because roadmaps keep their focus high-level, they give a cross-functional team a lot of freedom in translating that strategy into tasks, timelines, priorities, and resource allocation.

How Can You Leverage Both Gantt Charts and Product Roadmaps?
Although these tools take different approaches to move projects forward, Gantt charts and product roadmaps can support each other in an organization. Here’s how that might work in practice.
The cross-functional team will first create a product roadmap to:
- Develop and capture a high-level strategy for the product.
- Communicate the strategy to relevant stakeholders to ensure everyone is aligned around a shared set of goals and plans for the product.
- Present the roadmap to the executive team (and perhaps investors) for approval to proceed with the high-level plan.
- Make the roadmap accessible to all relevant contributors across the company, so anyone can check in to ensure their daily tasks are still on track and supporting the big-picture plans.
Then the team can translate the roadmap’s plans into a detailed Gantt chart that will:
- Break the project into time-based steps, phases, and detailed tasks.
- Display all task dependencies (and their related deadlines) across the schedule.
- Set expected timelines and due dates for each task and each stage of the project.
Gantt charts and roadmaps serve very different purposes. But an organization doesn’t have to choose between them. If used properly, they can work together to help a team combine their plan’s strategic elements with the tactical detail needed to execute that plan successfully.